CRISPR activation sgRNA clones
Activate the transcription of any endogenous gene of interest, without cutting the DNA
| Vector | Promoter | CRISPR option | Selection Marker / Reporter Gene | Vector Type | Vector Map |
|---|---|---|---|---|---|
| pCRISPR-AG01 | U6 | CRISPRa dCas9 SAM | Puro / eGFP | Lentiviral | |
| pCRISPR-AG02 | U6 | CRISPRa dCas9 SAM | Puro / eGFP | Lentiviral |
Overview
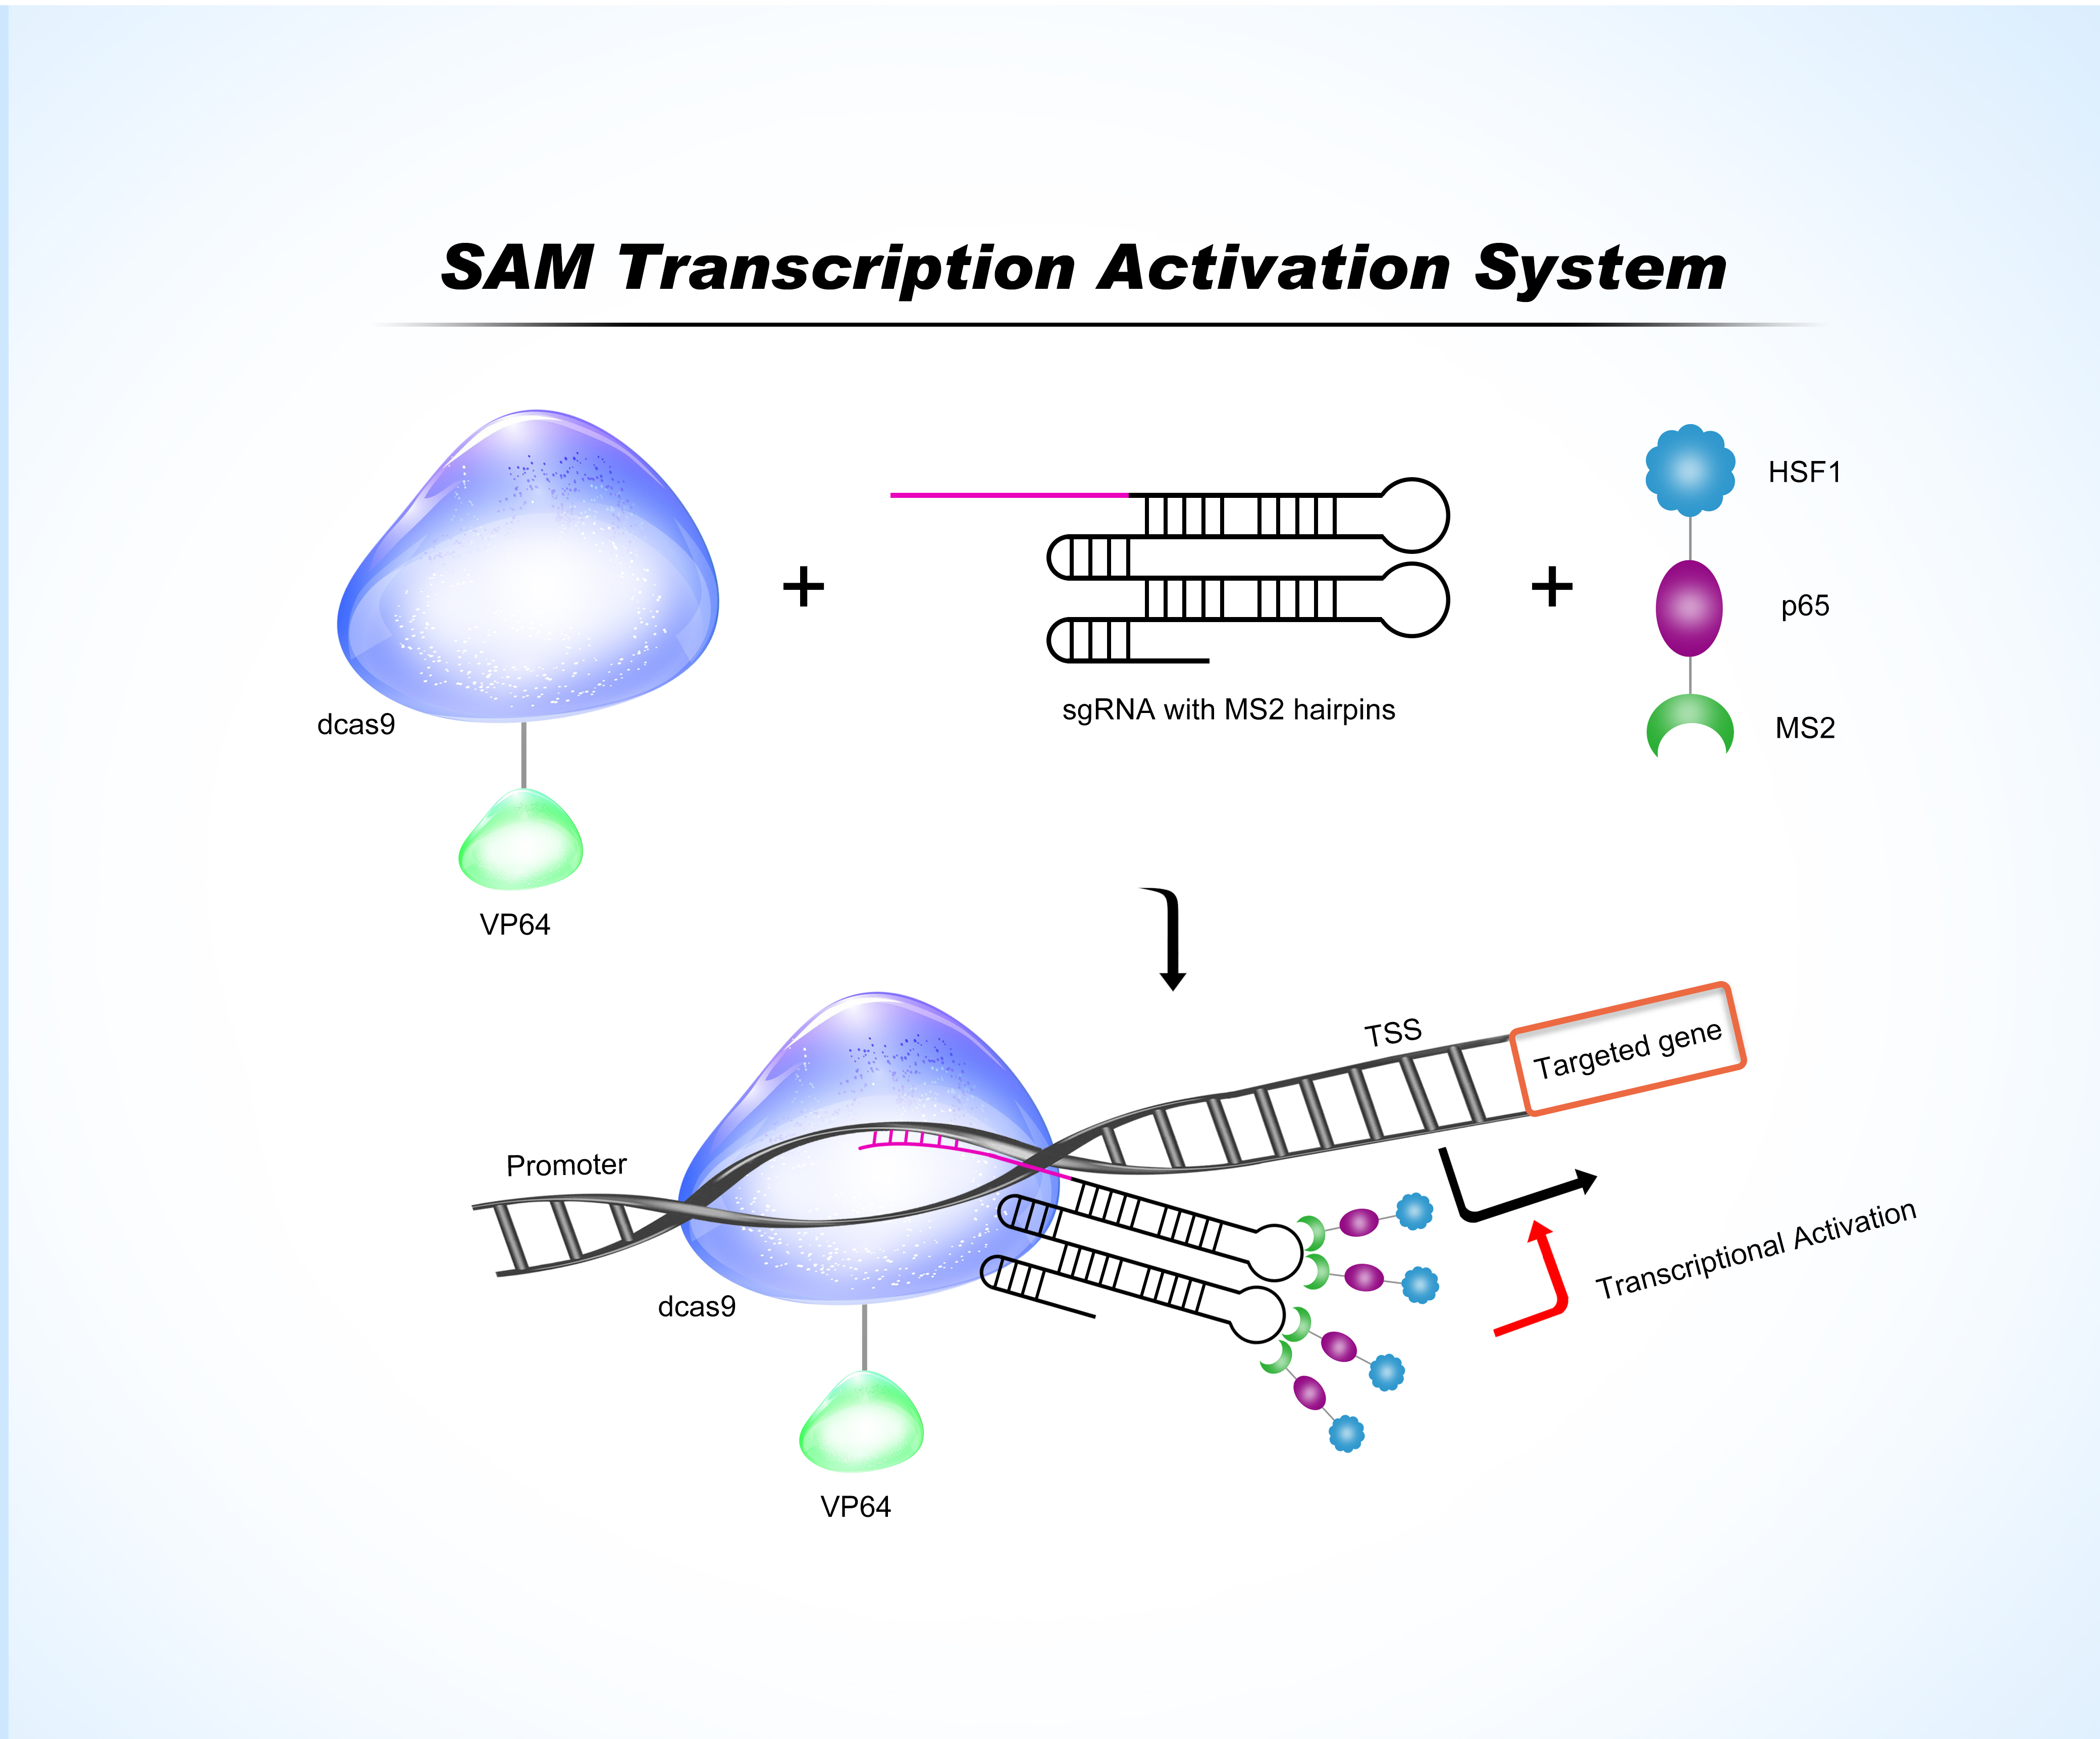 The CRISPR (SAM) system (CRISPR-based Synergistic Activation Mediator) is designed to activate the transcription of any endogenous gene of interest. The system comprises 3 components that form a DNA-binding complex once transfected into the cells.
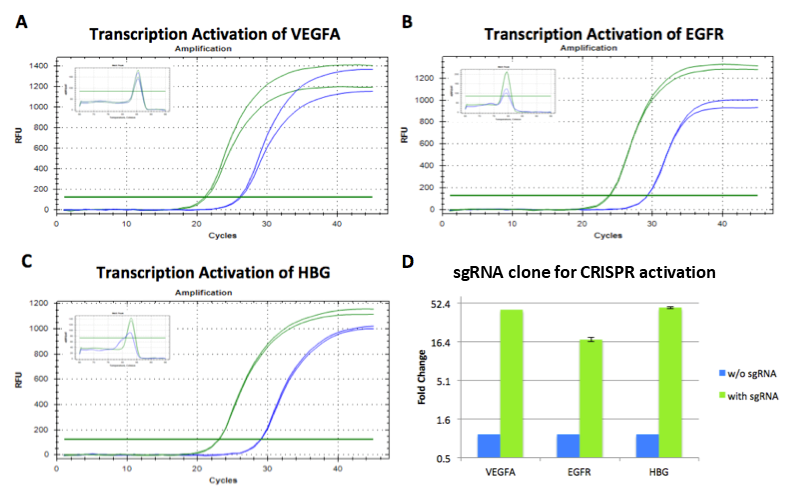 The MPH complex, dCas9-VP64 and sgRNA were co-overexpressed in HEK293 cells. The transcriptional activity of VEGFA (Figure A), EGFR (Figure B), and HBG (Figure C) was detected by qPCR. The cell proliferation curves for cells transduced with sgRNA are shown in green, while those for cells without sgRNA transduction are shown in blue. The transcriptional levels of the target genes were compared with those of GAPDH, indicating a significant increase in the transcriptional levels of the target genes in HEK293 cells.
- dCas9 fused to transcriptional activator VP64: VP64 acts as a strong transcriptional activator when recruited by a DNA-binding protein
- sgRNA with an MS2 adaptor forming a characteristic stem-loop structure: The sgRNA-MS2 component forms a complex with dCas9 and directs it to the target DNA sequence next to the promoter region of the gene of interest
- MCP-p65-HSF1 fusion protein (MPH complex): Once captured in the assembled complex at the gene promoter, P65 and HSF1 synergize with VP64 to robustly activate transcription of the downstream target gene by as much as a hundred-fold, depending on the gene
Application
The MPH complex, dCas9-VP64 and sgRNA were co-overexpressed in HEK293 cells. The transcriptional activity of VEGFA (Figure A), EGFR (Figure B), and HBG (Figure C) was detected by qPCR. The cell proliferation curves for cells transduced with sgRNA are shown in green, while those for cells without sgRNA transduction are shown in blue. The transcriptional levels of the target genes were compared with those of GAPDH, indicating a significant increase in the transcriptional levels of the target genes in HEK293 cells.