COVID-19 Coronavirus Antigen Microarray
SARS-CoV-2 is a betacoronavirus that is the cause of the COVID-19 global pandemic that began in 2019. SARS-CoV-2 infection of humans typically stimulates a strong humoral immunity response, leading to the production of both neutralizing and binding antibodies.
GeneCopoeia provides COVID-19-related antigen microarrays for two purposes: 1) Association of autoimmunity against cytokines with SARS-CoV-2 infection (Coronavirus Associated Autoimunity microarray, catalog # PA012); and 2) Detection of antibodies against SARS-CoV-2 (including variants of concern) and other pathogens (SARS-CoV-2 Coronavirus Variant Proteins microarray, catalog # PA013).
In addition to these predesigned arrays, arrays containing customized sets of proteins are available, as well as array profiling services and data analysis.
GeneCopoeia’s OmicsArray™ SARS-CoV-2 Coronavirus Antigen Microarrays are part of the GeneCopoeia OmicsArray™ Antigen Microarray family.
Advantages
- Multiplexing capable. OmicsArray™ antigen microarrays can assay up to 120 antigens at a time, compared with 1 protein at a time for ELISA.
- High throughput. Each slide can process up to 15 samples in parallel.
- High sensitivity. Each array can detect as little as 1 pg/ml of antibody, which is 100-fold more sensitive than ELISA.
- Small sample volume. As little as 1 ul of serum is needed for detection.
- Fast. From sample-to-data in as little as 2 weeks.
Predesigned arrays Premade antigen microarrays GeneCopoeia’s OmicsArray™ COVID-19 Coronavirus Antigen Microarrays are premade protein microarrays. Please refer to the table below for more information.
User Manual
Custom protein microarrays are also available. To inquire about a custom protein microarray, please contact
inquiry@genecopoeia.
Custom services
Custom services
In addition to premade antigen microarrays, GeneCopoeia offers custom antigen microarray services in the following areas:
- Custom printing and spotting. GeneCopoeia will create custom antigen microarrays built to your specifications.
- Sample processing. Send us your blood, plasma, tissue, or other biological sample and we will prepare it for processing and incubation with any of our premade antigen microarrays or custom-built antigen microarrays
- Data analysis. Once samples are processed and incubated with an antigen microarray, we will analyze the raw data. The standard analysis service includes: 1) An Excel file of the Net Signal Intensity (NSI) for each antigen on the array, normalized to internal controls; and 2) a heat map
Additional analysis services, including proteomic analysis, pathway analysis, and more, are also available.
To inquire about custom antigen microarray services, please contact us at
inquiry@genecopoeia.com.
Technology overview
Technology overview
GeneCopoeia’s OmicsArray™ antigen microarrays contain up to 120 purified proteins spotted onto nitrocellulose filters, which are adhered to glass slides. In addition, 8 spots are included for normalization. Each slide carries 16 identical arrays, and so can be used to process up to 15 samples simultaneously as well as a negative control. As little as 1 ul serum or 50 ul of other bio fluids are needed for each sample.
As shown in Figure 1, arrays are incubated with patient samples, and any antibodies in the samples bind to their cognate antigens on the array. The arrays are washed to remove unbound antibodies and other proteins, then co-incubated with Cy3- and Cy5-labeled secondary antibodies. The dual labeling strategy is intended to distinguish between immunoglobulin (Ig) subtypes present within samples. For example. a Cy3-labeled anti-IgG secondary antibody is used to detect IgG antibodies, and a Cy5-labeled anti-IgM secondary antibody is used to detect IgM antibodies. Fluorophore-labeled secondary antobodies are available for detecting IgA, IgD, IgE, IgG and IgM immunoglubulins, as well as IgG subclasses IgG1, IgG2, IgG3, and IgG4.
After washing to remove unbound secondary antibodies, signals are detected using a GenePix® 4400A microarray scanner. The raw data is then analyzed using GenePix® 7.0 software.
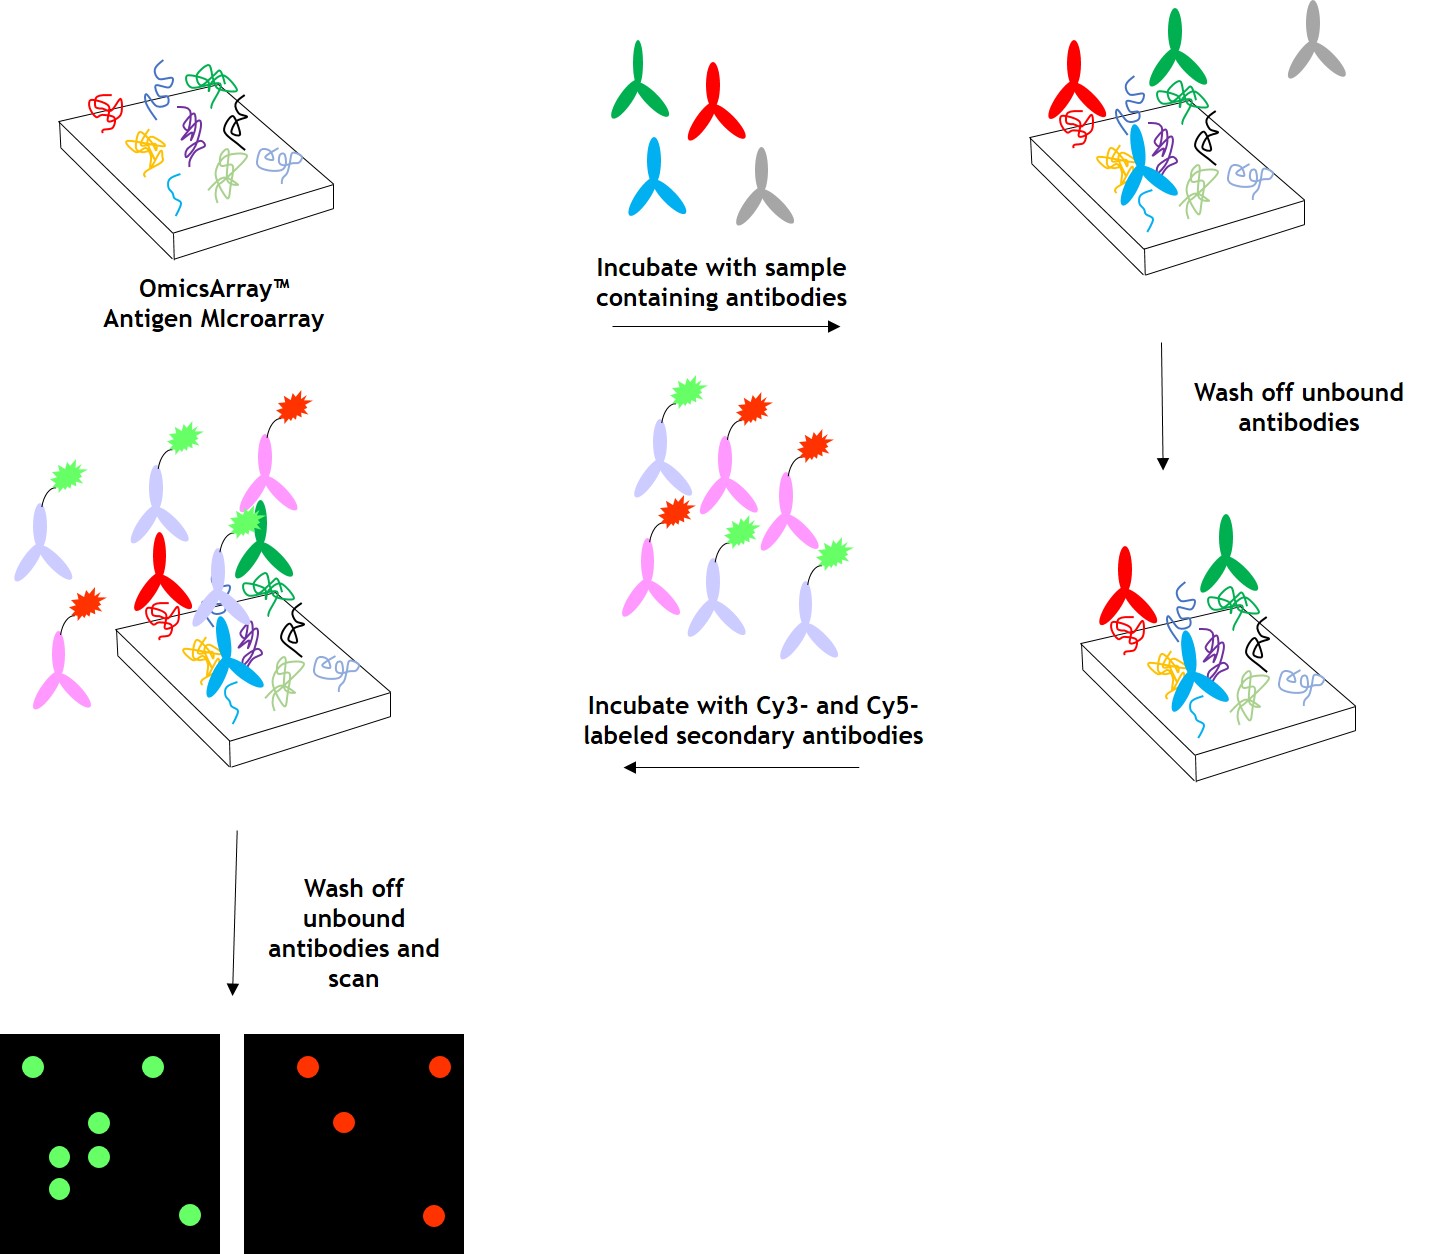
Figure 1. Workflow for detection of antibodies in samples using GeneCopoeia’s OmicsArray™ antigen microarrays.
Data analysis
Data analysis
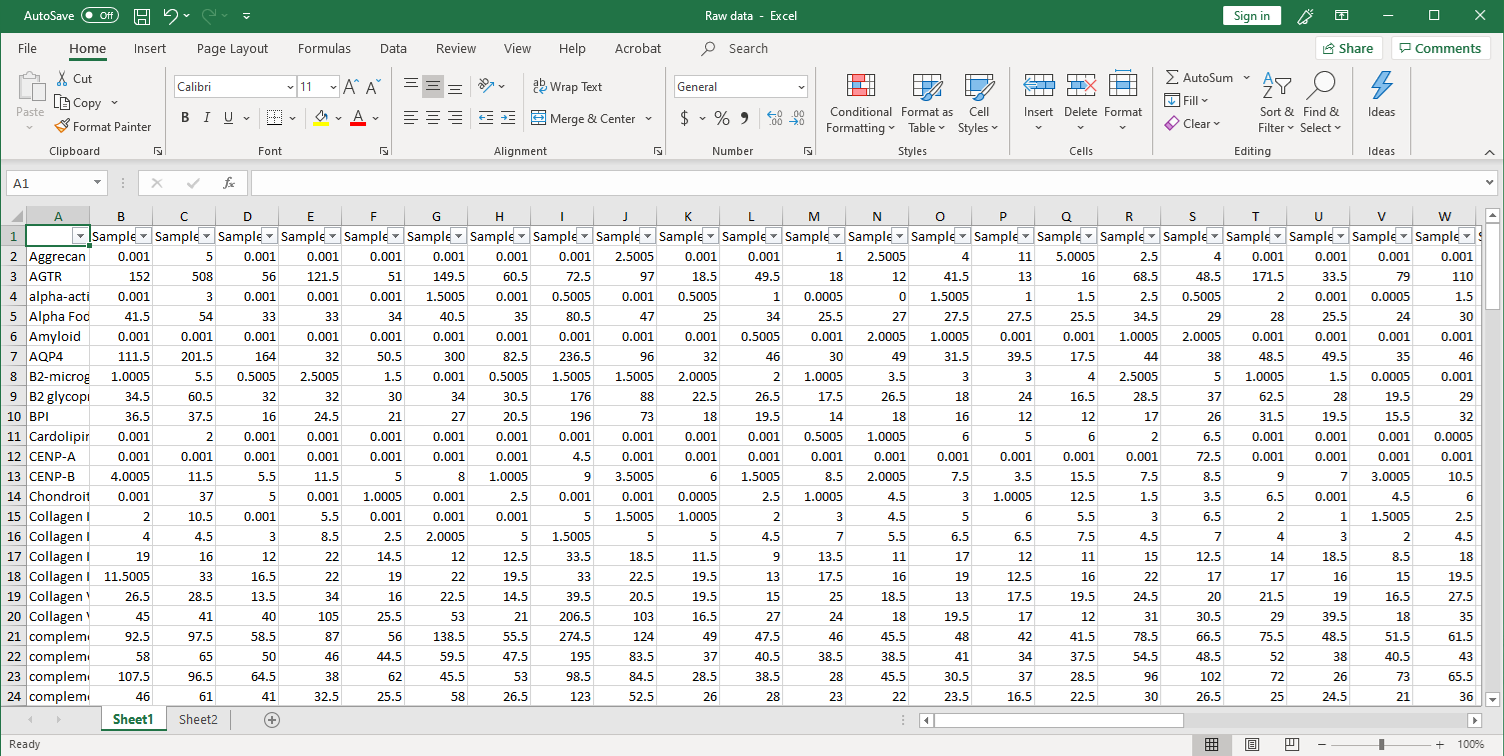
GeneCopoeia provides data analysis as part of its custom antigen microarray services. After array scanning, raw data are collected and analyzed using GenePix® 7.0 software. The standard service includes data normalization to include fold changes of, for example, disease vs. healthy control, and a heat map showing each antigen ranked by level of fold change. Our service undergoes the following steps: 1. Collection of raw data. After scanning, raw signal intensities are collected in an Excel file, as shown below.
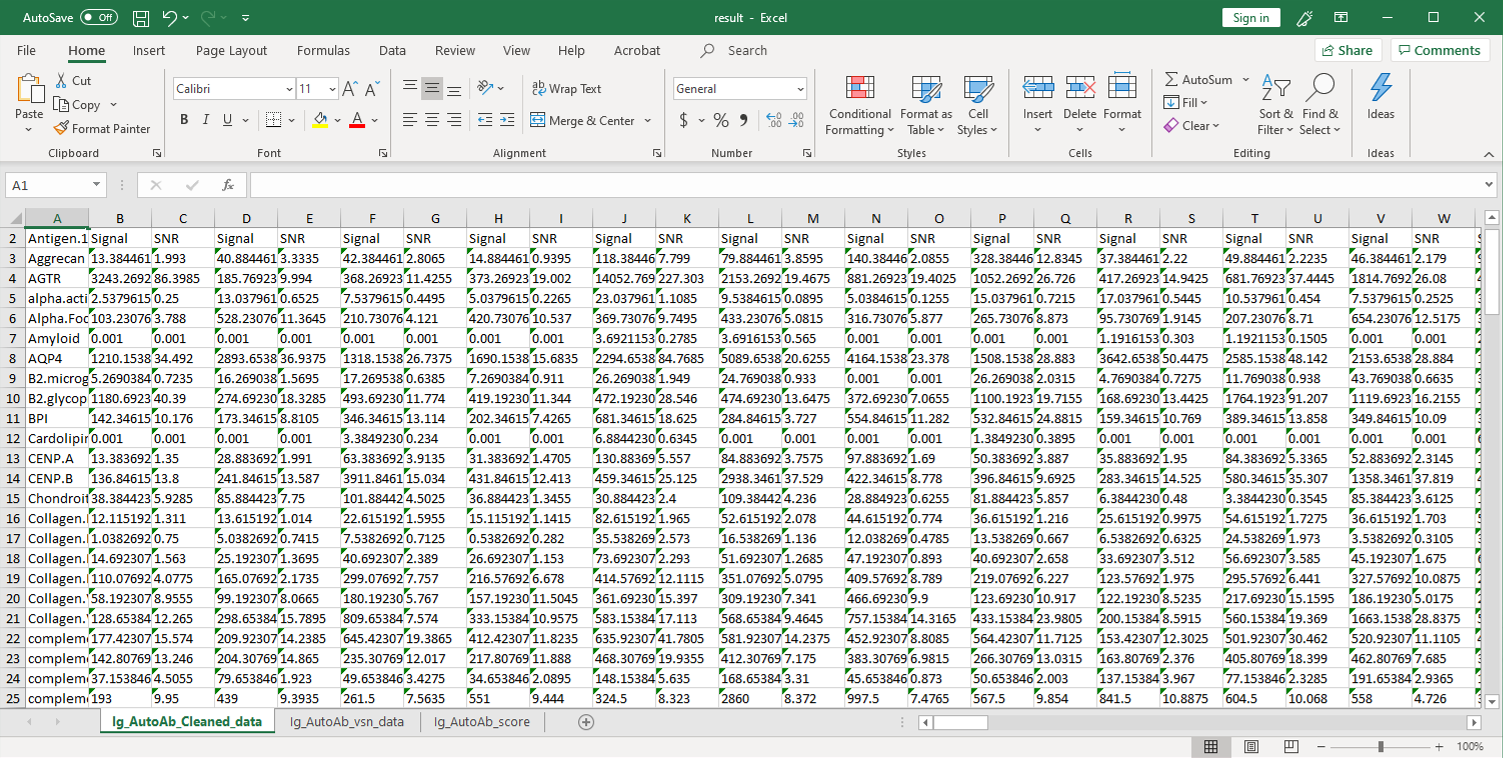
2. Next, the raw data are normalized to controls on the array, and the Net Signal Intensity (NSI) values, as well as the signal-to-noise ratios (SNRs) are tabulated in an Excel file,
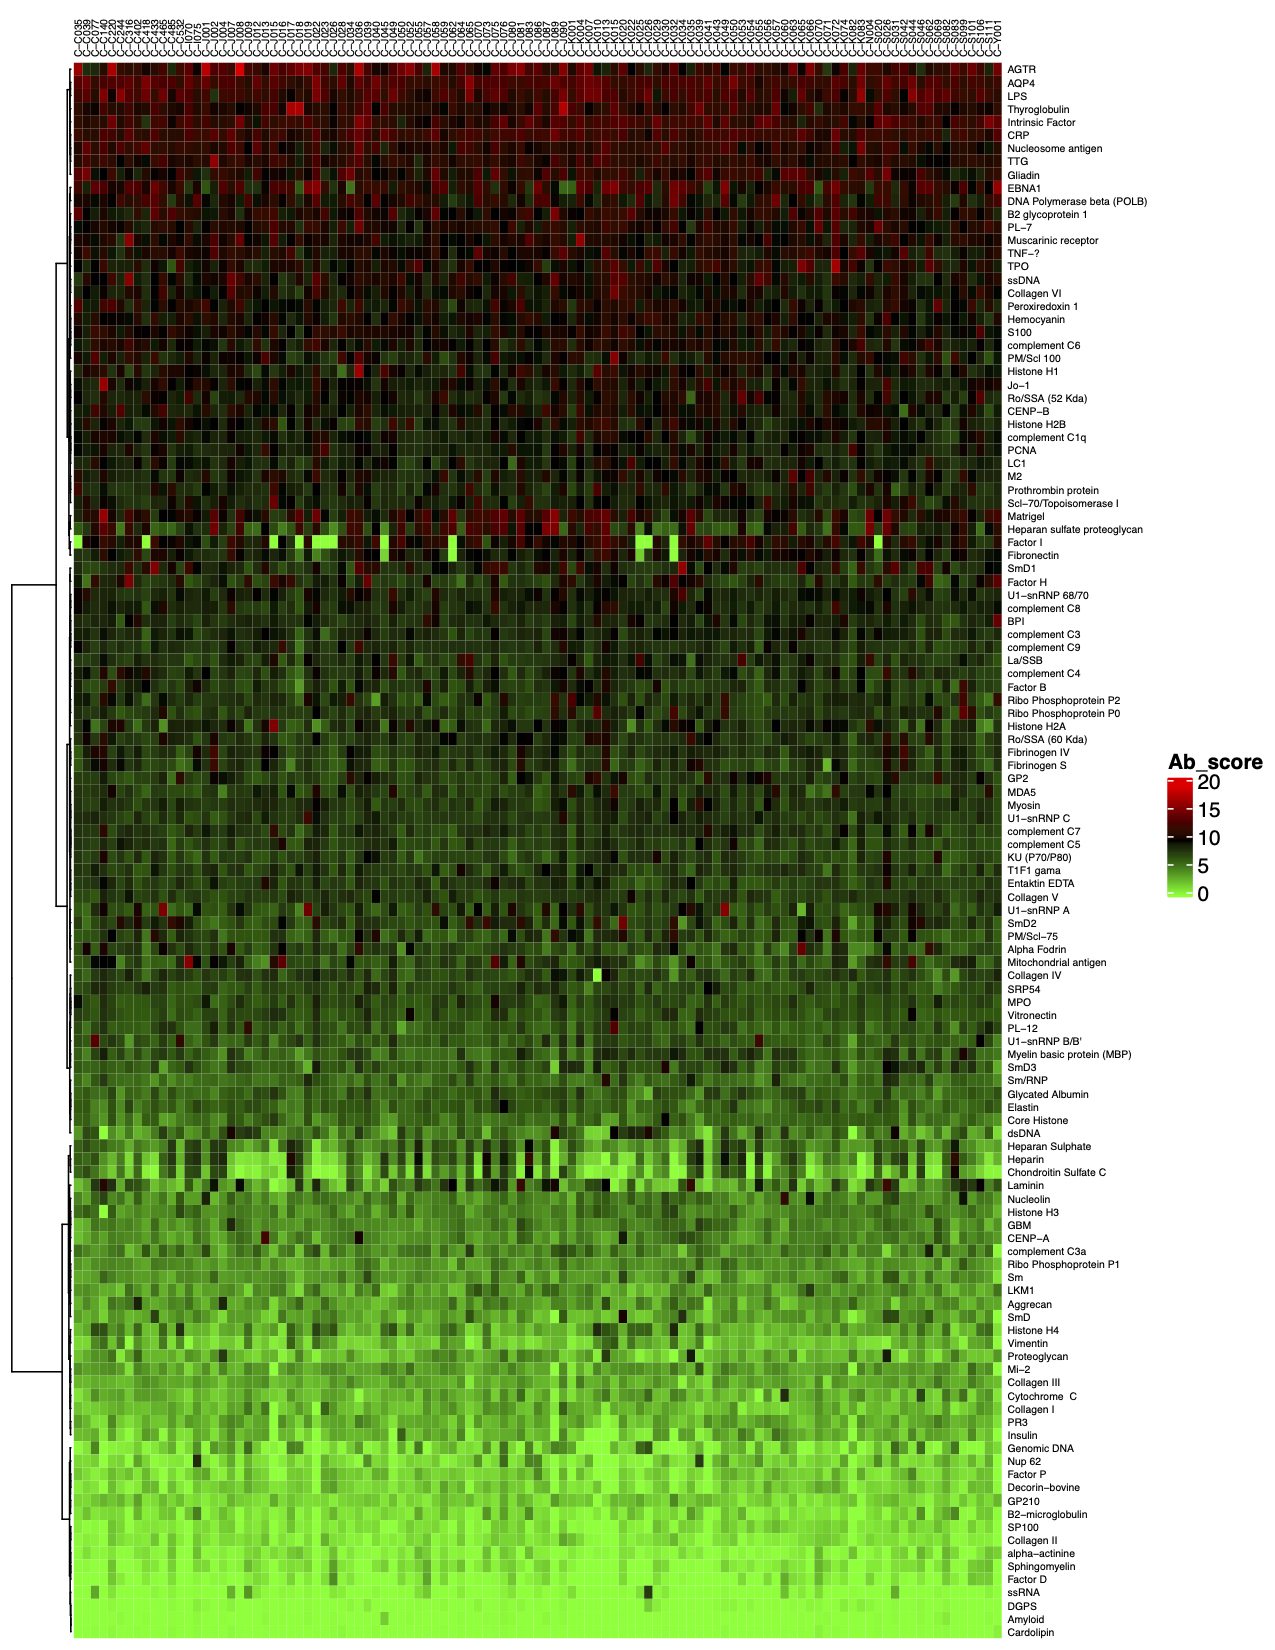
3. The final step of the standard analysis package is to determine the “Antibody score” which is the relative enrichment of a given antibody in a sample. The antibody score is determined numerically and displayed in a heat map. A higher score (shifted toward red on the heat map) suggests a stronger antibody-antigen interaction, as shown in the following example:
4. In addition to the standard data analysis package, customers can also choose custom data analysis services. One such service is to classify positive antigens on the array using
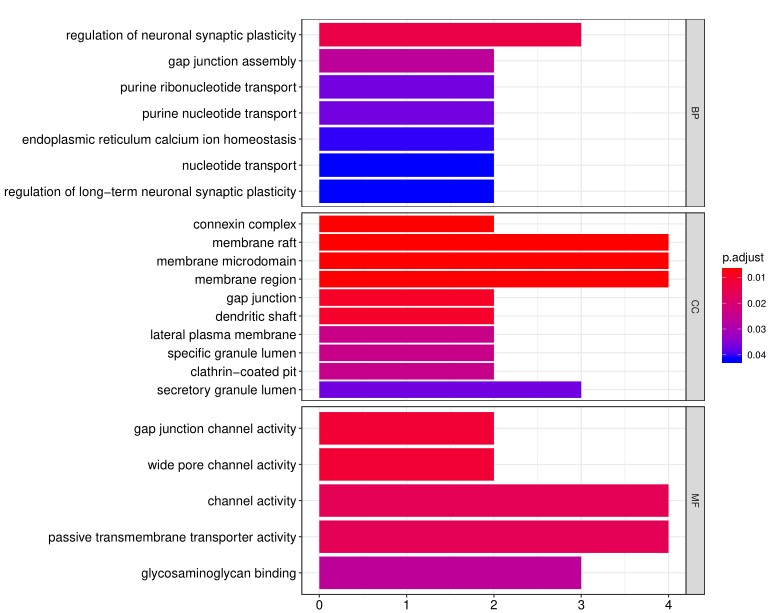
Gene Ontology (GO) analysis, which classifies genes and proteins based on known biolgical functions. An example of the readout from GO analysis for molecular function is shown below:
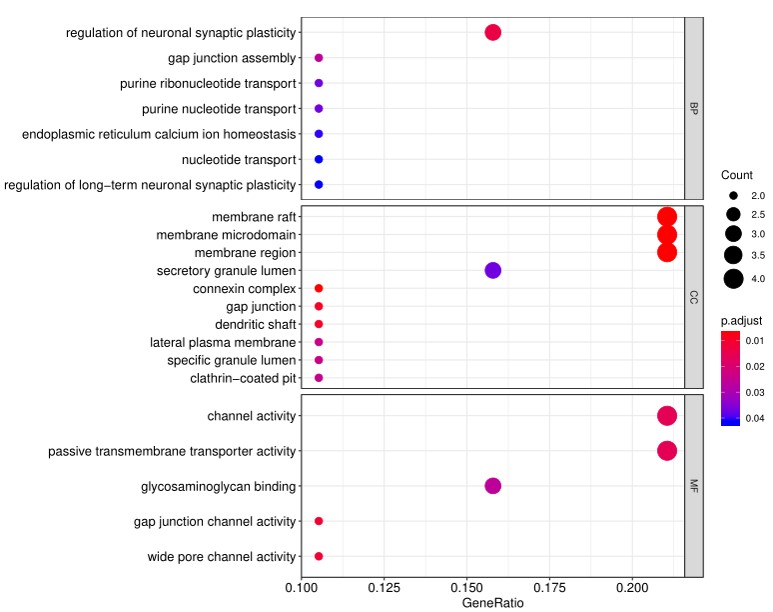
Further, GO analysis for biological processes is shown in the following example:
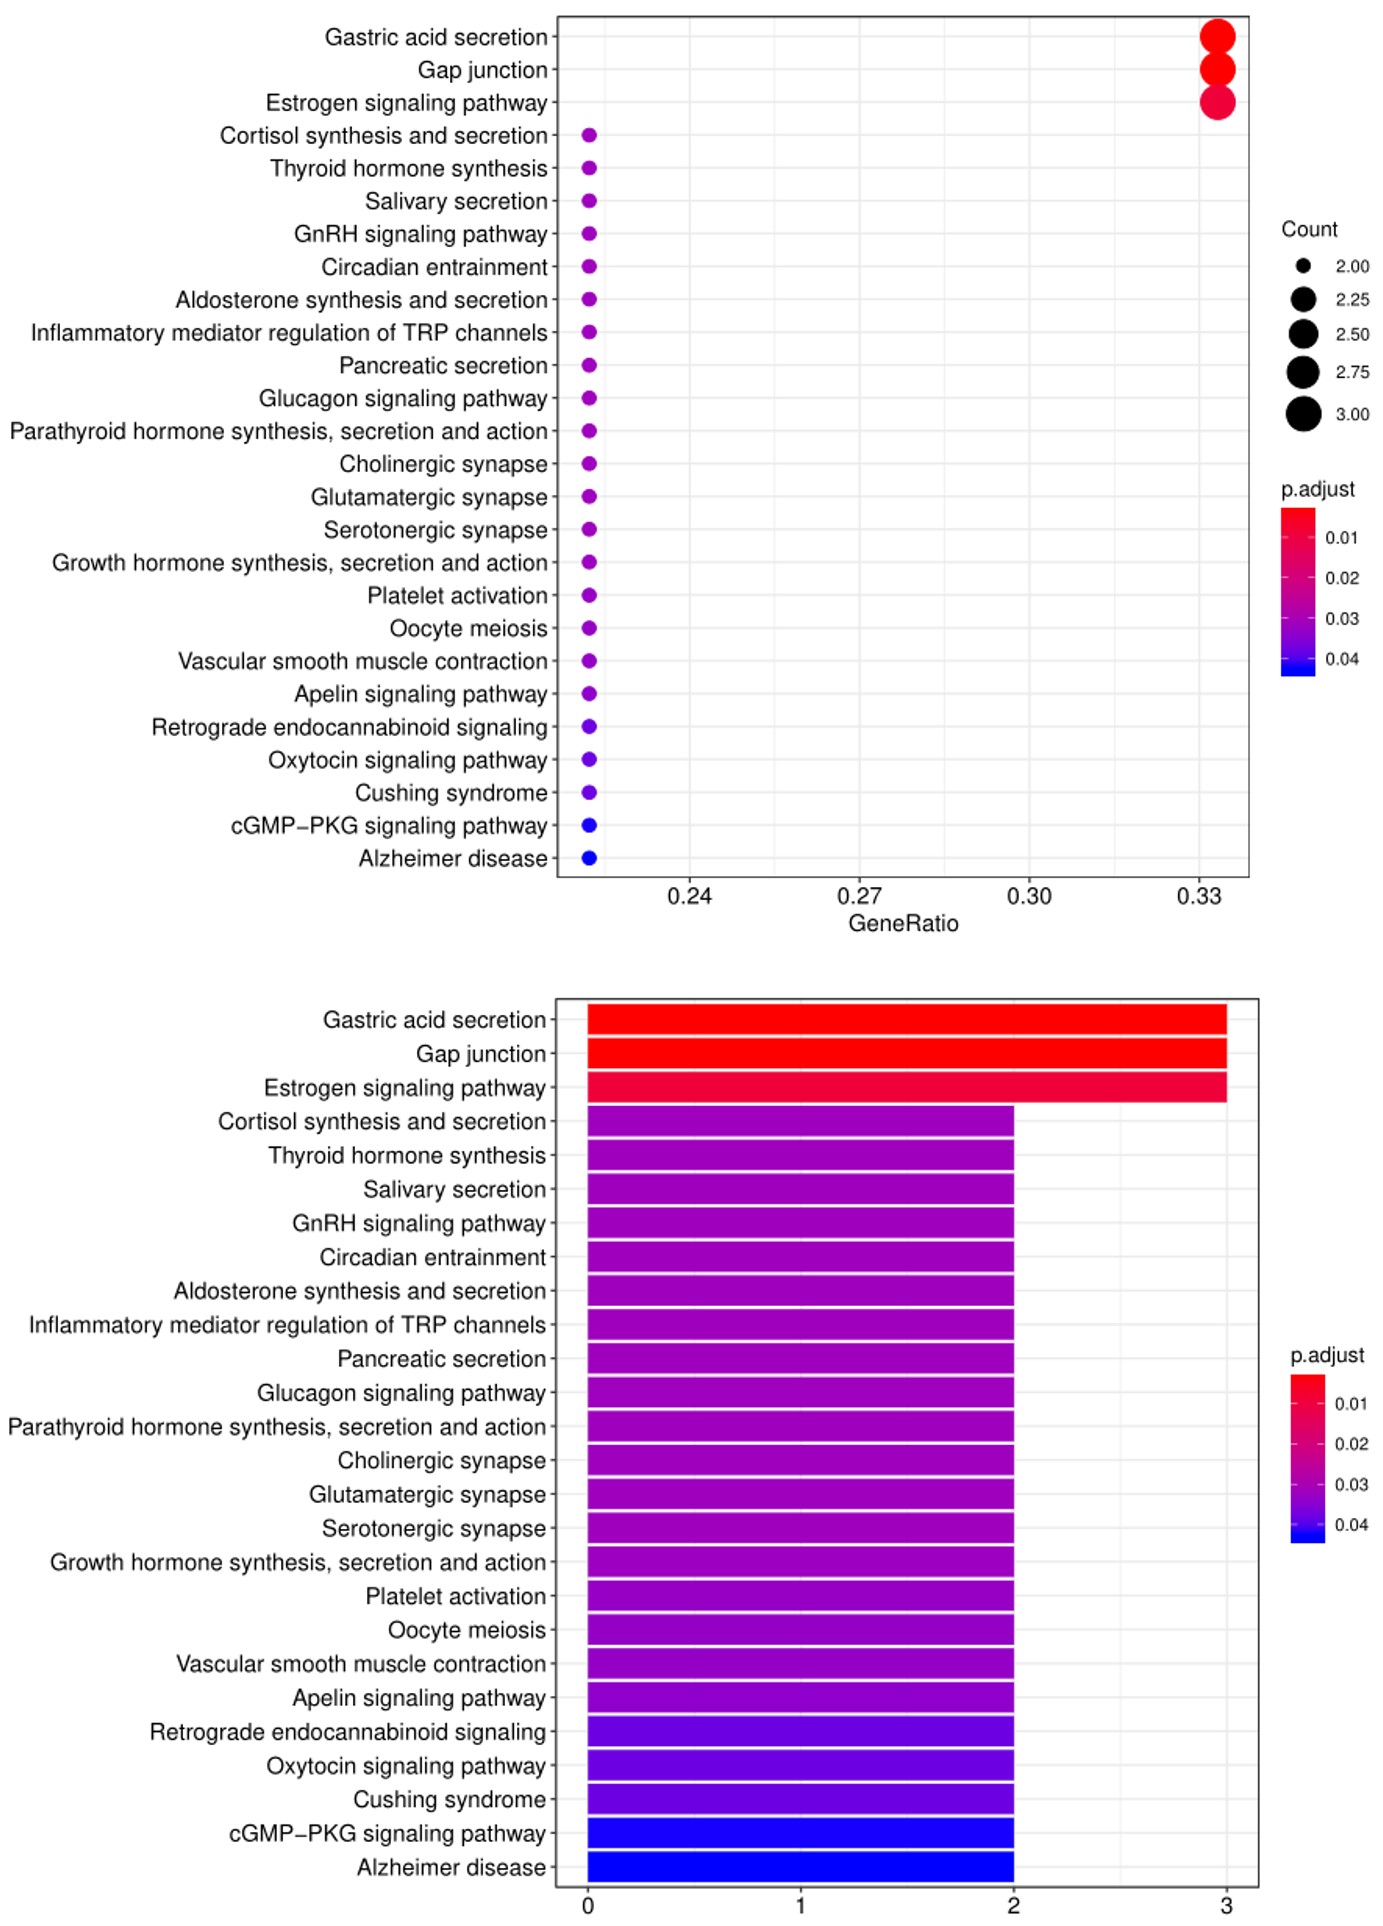
5. Another widely-used tool for bioinformatic analysis is KEGG (
Kyoto Enclycopedia for Genes and Genomes) Pathway Analysis, which we use to group positive antibody-antigen interactions on the basis of defined biologica pathways, as displayed in the example below:
Resources
Publications
View publications using GeneCopoeia antigen microarray products and services
Webinars
Title:Antigen Protein Microarrays For Effective Antibody Profiling.
Presented Wednesday, September 22, 2021
GeneCopoeia’s OmicsArray™ antigen microarrays are protein microarrays engineered for several powerful applications, including autoantibody detection, biomarker profiling, and characterization of protein-molecule interactions. Antigen microarrays enable parallel detection of antibodies or other biomarkers present in patient samples for diseases including rheumatoid arthritis, muscular dystrophy, systemic lupus erythematosus, and type 1 diabetes. In this webinar, we will describe the powerful application and advantages for using GeneCopoeia’s OmicsArray™ antigen microarrays for autoantibody detection, cancer immune checkpoint inhibition autoantibody profiling, and SARS-CoV-2 serological analysis.
Frequently Asked Questions
Answer: You can send us virtually any biological sample, including whole blood, serum, plasma, interstitial fluid, semen, urine, and saliva. To learn more, please contact us at
inquiry@genecopoeia.com.
Answer: Yes.
Answer: Yes.
Answer: Yes.
Answer: Each nitrocellulose membrane is surrounded by a gasket to prevent leakage and cross-contamination.
Answer: a. Each slide carries 16 identical arrays. One of these is reserved for a PBS control, while the remaining 15 are used for incubation of each sample. Therefore, the total number of samples sent by the customer is preferably a multiple of 15. However, if you have fewer than 15 samples, we will need to charge you for the full cost of an entire slide of 15 samples. b. Theoretically, each of the different test groups requires a minimum of 3 samples to meet statistical reproducibility requirements. On this basis, the greater the number of samples, the higher the reproducibility of the results in the test group. In order to ensure the reliability of the results, the sample size of different test groups is recommended to be ≥30.
Answer: The antigen microarray uses fluorescence detection, and its sensitivity is higher and more stable than ELISA (colorimetry) and Western (chemiluminescence). The technical repetition correlation coefficient R2 between the arrays can reach 0.9 or more. The dynamic detection range is 1-65000. The larger the dynamic range, the more layers of signals that can be detected.
Answer: Please fully communicate with our Technical Support staff before the experiment to explain the purpose of the experiment and the sample status, to determine whether we can meet your needs and determine the experimental plan.
Answer: The antigens on the antigen array are all derived from self-antigens reported in the literature. For each of the different types of antigenic arrays, we have shown 20 related antigens. After you have signed the appropriate service agreement, we will provide you with all the antigens and related information before you publish your own antigen array test results. Please do not disclose this information to third parties.
Answer: Proteins are usually expressed and purified from E. coli or mammalian cells.
Answer: We usually spot the entire full-length protein in its native conformation. However, we can also spot truncated proteins or peptides if needed.
Answer: If you need a custom antigen microarray, we need to fully communicate with you about the following issues: a. The intellectual property of the antigen (whether from a published paper or a patent, etc.). We can only provide customized detection of antigens that do not involve patent protection; b. Basic information about the antigen (whether it is whole protein or peptide, molecular weight, domain, whether it is a membrane protein, etc.); c. Whether you can provide an antigen that meets the requirements of a custom array; d. If we need to provide the antigen to be tested, the corresponding cost and experimental time frame need to be accounted for separately.
Answer: The antigens on our predesigned arrays are usually human. However, for custom arrays, we can use antigens from virtually any organism.
Answer: The customer can choose whether or not to conduct a pre-experiment. If the pre-experiment is carried out, the customer can provide up to 15 samples (subject to the sample requirements). If you continue with the service and the pre-experiment data is available, the normal sample fee will be charged.
Answer: Antigens are usually spotted at a concentration between 0.1 and 1.0 mg/ml, but each individual protein concentration requires optimization.
Answer: a. This difference may be related to the detection method. The protein used on the array is a non-denatured protein, which is different from western blot. The hybrid system of the chip is an antigen-trapping antibody, and the western blot antigen is slightly different from the antibody after being transfected with the antigen. Therefore, it may cause some differences; b. Please provide a graph of the results of western blot verification, so that we can better analyze the image and data of your verified indicators on the array.