Product Information
GeneCopoeia’s OmicsArray™ Ganglioside and Phospholipid Antigen Microarray carries 21 antigens that can detect autoantibodies in human or other animal samples. These autoantibodies are associated primarily with neurological autoimmune diseases, including Guillain-Barre syndrom, Myelitis, Brown-Sequard Syndrome, and Miller-Fisher syndrome.
These antigens, which are non-proteinaceous, are hydrophobic and are specialy treated to mantain their appopriate 3 dimensional structures when applied to a nitrocellulose membrqane.
This array has several important features, as follows:
- Largest collection of ganglioside and phospholipid antigens.
- Antigens are spotted to preserve their natural conformations.
- Each antigen is spotted in 3 concentrations, each in duplcate (6 spots per antigen).
- Wide application for autoimmune disorders such as neurological diseases, anti-phospholipid syndrome (APS) and others.
In addition to premade arrays, arrays containing customized sets of antigens are available, as well as array processing kits, array profiling services and data analysis. To order premade or custom arrays, please contact us.
GeneCopoeia’s OmicsArray™ Ganglioside and Phospholipid Antigen Array is part of the GeneCopoeia OmicsArray™ Antigen Microarray family.
References
- Gregson NA, Pytharas M, Leibowitz S (1977). “The reactivity of anti-ganglioside antiserum with isolated cerebellar cells“. Biochem. Soc. Trans. 5 (1): 174–5.
- Willison HJ, O’Hanlon G, Paterson G, et al. (1997). “Mechanisms of action of anti-GM1 and anti-GQ1b ganglioside antibodies in Guillain–Barré syndrome“. J. Infect. Dis. 176 Suppl 2: S144–9.
- Ho TW, Willison HJ, Nachamkin I, et al. (1999). “Anti-GD1a antibody is associated with axonal but not demyelinating forms of Guillain–Barré syndrome“. Ann. Neurol. 45 (2): 168–73.
- Ang CW, Yuki N, Jacobs BC, et al. (1999). “Rapidly progressive, predominantly motor Guillain–Barré syndrome with anti-GalNAc-GD1a antibodies“. Neurology. 53 (9): 2122–7.
- Chapman J, Sela BA, Wertman E, Michaelson DM (1988). “Antibodies to ganglioside GM1 in patients with Alzheimer’s disease“. Neurosci. Lett. 86 (2): 235–40.
- Gregson NA, Koblar S, Hughes RA (1993). “Antibodies to gangliosides in Guillain–Barré syndrome: specificity and relationship to clinical features“. Q. J. Med. 86 (2): 111–7.
- Irie S, Saito T, Kanazawa N, et al. (1997). “Relationships between anti-ganglioside antibodies and clinical characteristics of Guillain–Barré syndrome“. Intern. Med. 36 (9): 607–12.
- Bansal AS, Abdul-Karim B, Malik RA, et al. (1994). “IgM ganglioside GM1 antibodies in patients with autoimmune disease or neuropathy, and controls“. J. Clin. Pathol. 47 (4): 300–2.
- Salih AM, Nixon NB, Gagan RM, et al. (1996). “Anti-ganglioside antibodies in patients with rheumatoid arthritis complicated by peripheral neuropathy“. Br. J. Rheumatol. 35 (8): 725–31.
- García Guijo C, García-Merino A, Rubio G (1995). “Presence and isotype of anti-ganglioside antibodies in healthy persons, motor neuron disease, peripheral neuropathy, and other diseases of the nervous system“. J. Neuroimmunol. 56 (1): 27–33.
- O’Hanlon GM, Plomp JJ, Chakrabarti M, et al. (2001). “Anti-GQ1b ganglioside antibodies mediate complement-dependent destruction of the motor nerve terminal“. Brain. 124 (Pt 5): 893–906.
- Sinha S, Prasad KN, Jain D, Pandey CM, Jha S, Pradhan S (2007). “Preceding infections and anti-ganglioside antibodies in patients with Guillain–Barré syndrome: a single centre prospective case-control study“. Clin. Microbiol. Infect. 13 (3): 334–7.
- Yuki N, Handa S, Tai T, et al. (1995). “Ganglioside-like epitopes of lipopolysaccharides from Campylobacter jejuni (PEN 19) in three isolates from patients with Guillain–Barré syndrome“. J. Neurol. Sci. 130 (1): 112–6.
- Rees JH, Gregson NA, Hughes RA (1995). “Anti-ganglioside GM1 antibodies in Guillain–Barré syndrome and their relationship to Campylobacter jejuni infection“. Ann. Neurol. 38 (5): 809–16.
- Volta U, De Giorgio R, Granito A, et al. (2006). “Anti-ganglioside antibodies in coeliac disease with neurological disorders“. Digestive and Liver Disease. 38 (3): 183–7.
- Alaedini A, Latov N (2006). “Transglutaminase-independent binding of gliadin to intestinal brush border membrane and GM1 ganglioside“. J. Neuroimmunol. 177 (1–2): 167–72.
- Mathiesen T, von Holst H, Fredrikson S, et al. (1989). “Total, anti-viral, and anti-myelin IgG subclass reactivity in inflammatory diseases of the central nervous system“. J. Neurol. 236 (4): 238–42.
- McCombe PA, Wilson R, Prentice RL (1992). “Anti-ganglioside antibodies in peripheral neuropathy“. Clinical and Experimental Neurology. 29: 182–8.
- Willison HJ, Chancellor AM, Paterson G, et al. (1993). “Antiglycolipid antibodies, immunoglobulins and paraproteins in motor neuron disease: a population based case-control study“. J. Neurol. Sci. 114 (2): 209–15.
The listed chip prices apply to academic customers. For custom arrays and services pricing, please contact us.
Custom services
GeneCopoeia offers custom antigen microarray services in the following areas:
- Custom array printing. GeneCopoeia will create custom antigen microarrays built to your specifications.
- Sample processing. Send us your blood, plasma, tissue, or other biological sample and we will prepare it for processing and incubation with any of our premade antigen microarrays or custom-built antigen microarrays for autoantibody profiling and other applications. For information on sample types to submit, consult the FAQ
- Data analysis. Once samples are processed and incubated with an antigen microarray, we will analyze the raw data. The standard analysis service includes: 1) An Excel file of the Net Signal Intensity (NSI) for each antigen on the array, normalized to internal controls; and 2) a heat map
Additional analysis services, including proteomic analysis, pathway analysis, and more, are also available.
To inquire about custom antigen microarray products and services, please fill out our custom quote request form.
Technology overview
Advantages of OmicsArray™ Antigen Microarrays
- Largest collection of pre-made whole-protein antigen microarrays on the market.
- Largest number of whole-protein antigens specifically focused on autoimmune diseae research.
- Best combination of number of antigens per array (up to 120) with number of samples that can be processed per slide (up to 15).
Technology overview
GeneCopoeia’s OmicsArray™ antigen microarrays contain up to 120 purified proteins spotted onto nitrocellulose filters, which are adhered to glass slides. In addition, 8 spots are included for normalization. Each slide carries 16 identical arrays, and so can be used to process up to 15 samples simultaneously as well as a negative control. As little as 1 ul serum or 50 ul of other bio fluids are needed for each sample.
As shown in Figure 1, arrays are incubated with patient samples, and any antibodies in the samples bind to their cognate antigens on the array. The arrays are washed to remove unbound antibodies and other proteins, then co-incubated with Cy3- and Cy5-labeled secondary antibodies. The dual labeling strategy is intended to distinguish between immunoglobulin (Ig) subtypes present within samples. For example. a Cy3-labeled anti-IgG secondary antibody is used to detect IgG antibodies, and a Cy5-labeled anti-IgM secondary antibody is used to detect IgM antibodies. Fluorophore-labeled secondary antibodies are available for detecting IgA, IgD, IgE, IgG and IgM immunoglubulins, as well as IgG subclasses IgG1, IgG2, IgG3, and IgG4.
After washing to remove unbound secondary antibodies, signals are detected using a microarray scanner (e.g., GenePix® 4000B, InnoScan 710, or equivalents). The raw data is then be analyzed using GenePix® Pro 7.0, or Mapix software.
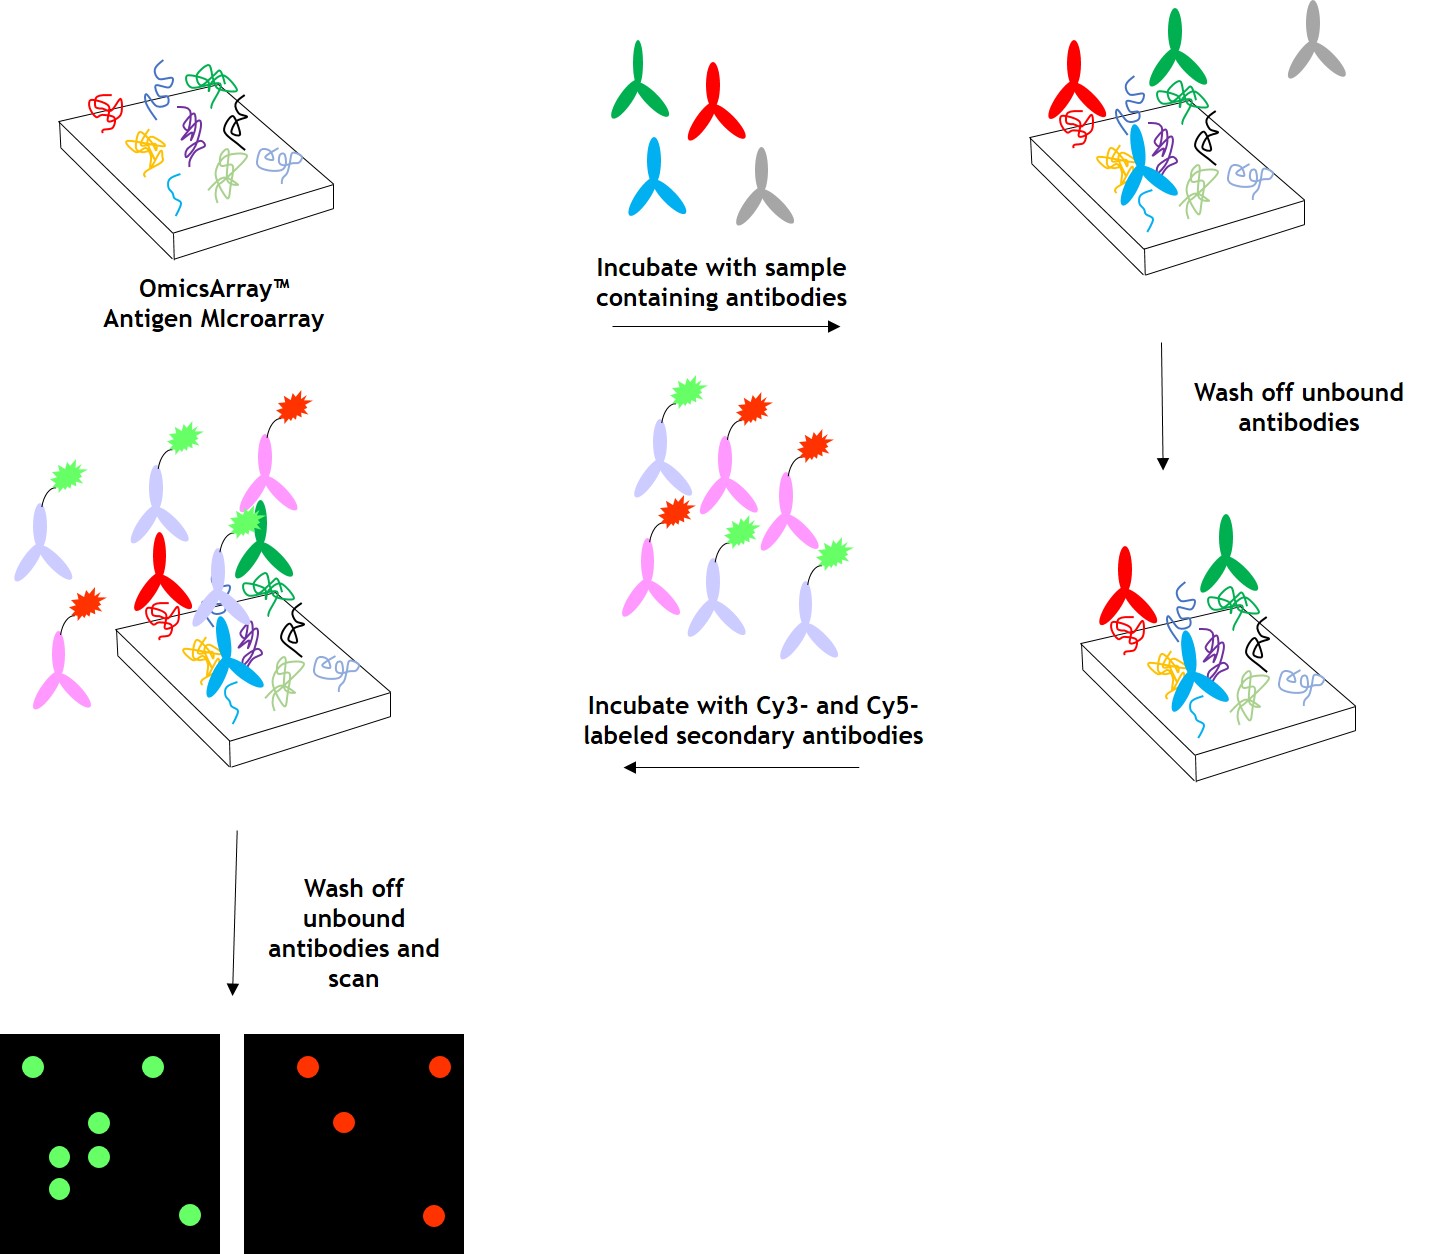
Figure 1. Workflow for detection of antibodies in samples using GeneCopoeia’s OmicsArray™ antigen microarrays.
Data analysis
GeneCopoeia provides data analysis as part of its custom antigen microarray services. After array scanning, raw data are collected and analyzed using GenePix® 7.0 software. The standard service includes data normalization to include fold changes of, for example, disease vs. healthy control, and a heat map showing each antigen ranked by level of fold change. Our service undergoes the following steps:
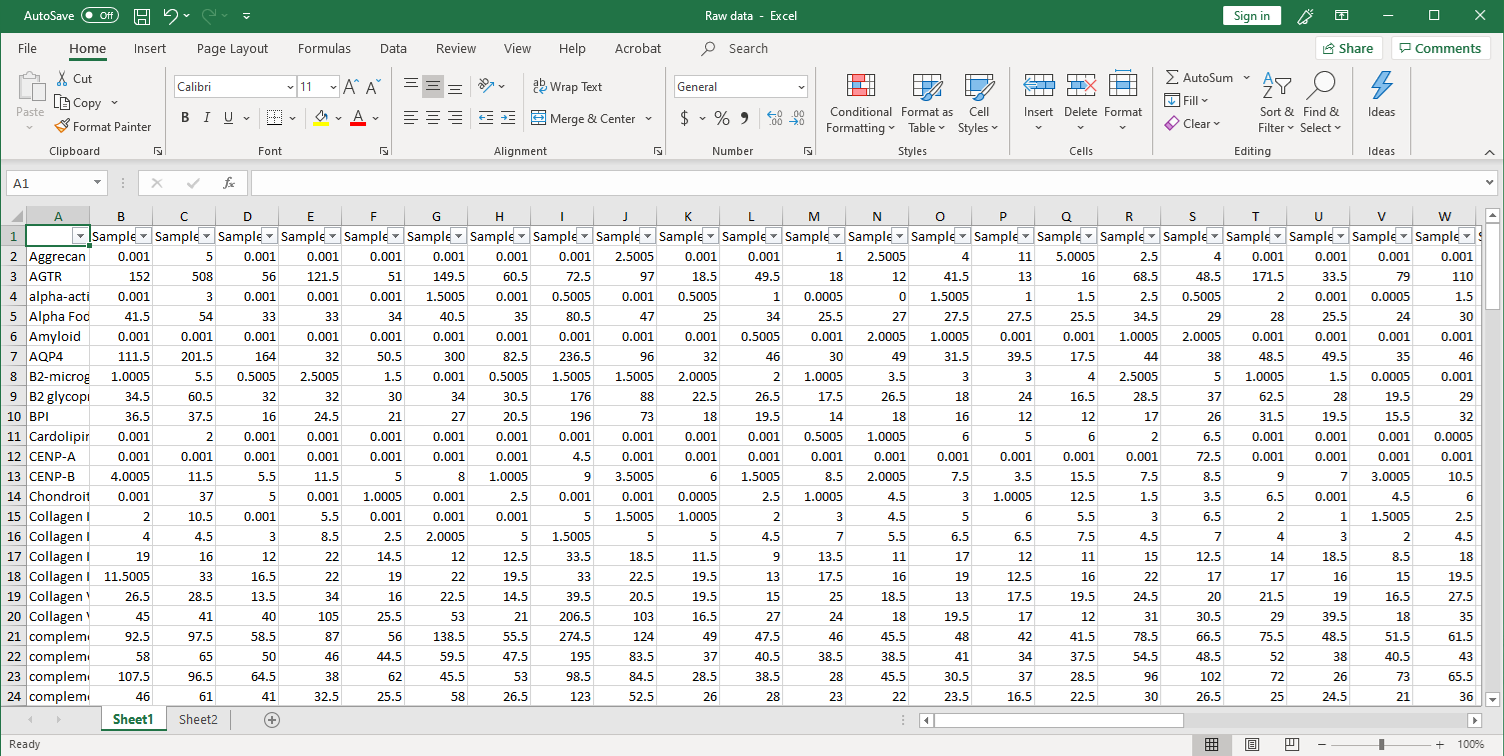
1. Collection of raw data. After scanning, raw signal intensities are collected in an Excel file, as shown below.
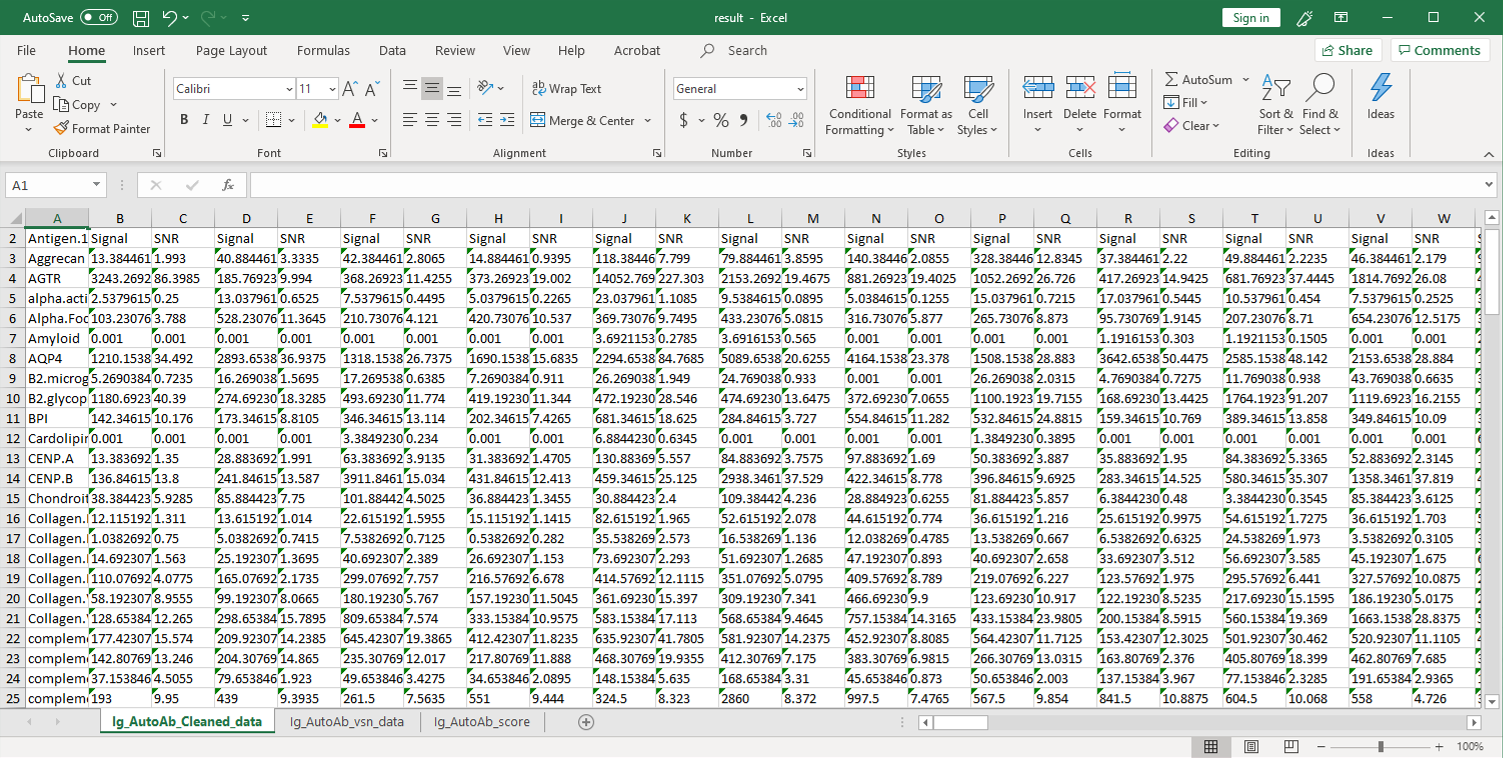
2. Next, the raw data are normalized to controls on the array, and the Net Signal Intensity (NSI) values, as well as the signal-to-noise ratios (SNRs) are tabulated in an Excel file,
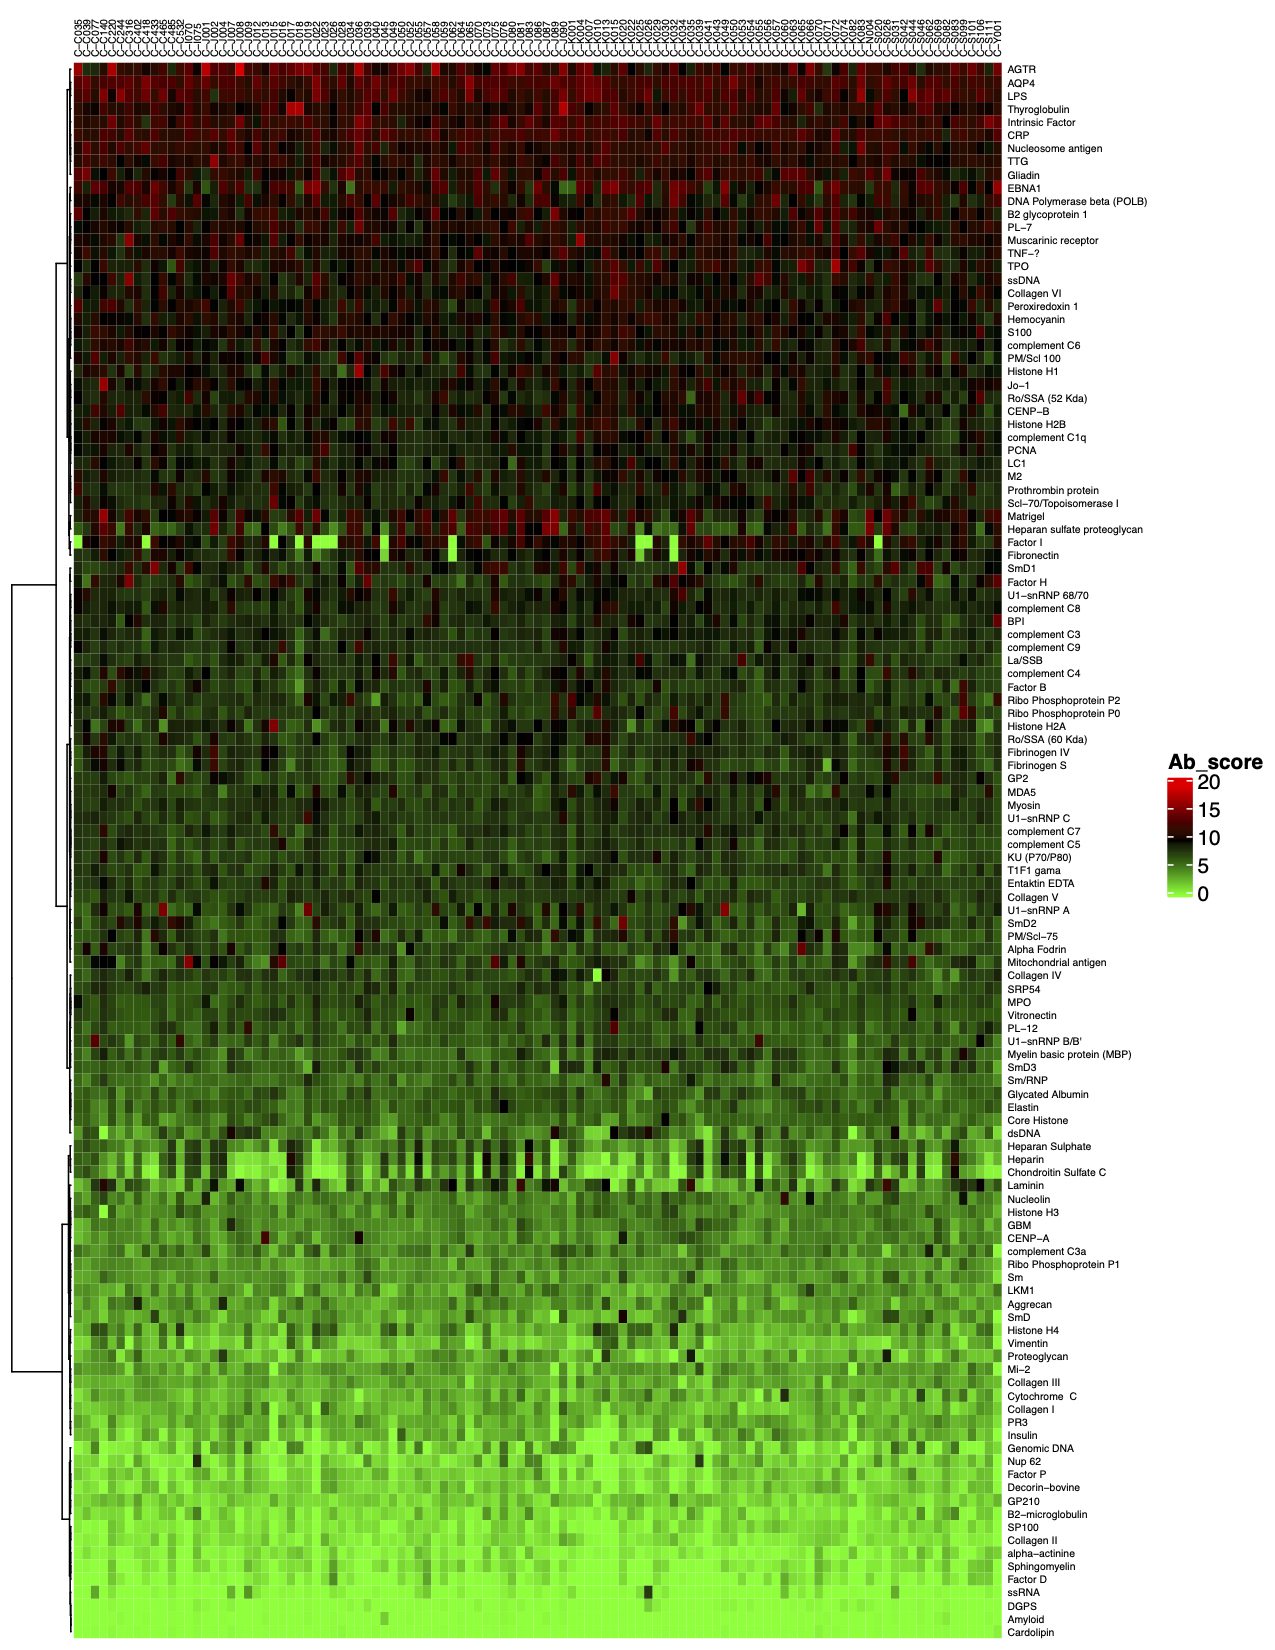
3. The final step of the standard analysis package is to determine the “Antibody score” which is the relative enrichment of a given antibody in a sample. The antibody score is determined numerically and displayed in a heat map. A higher score (shifted toward red on the heat map) suggests a stronger antibody-antigen interaction, as shown in the following example:
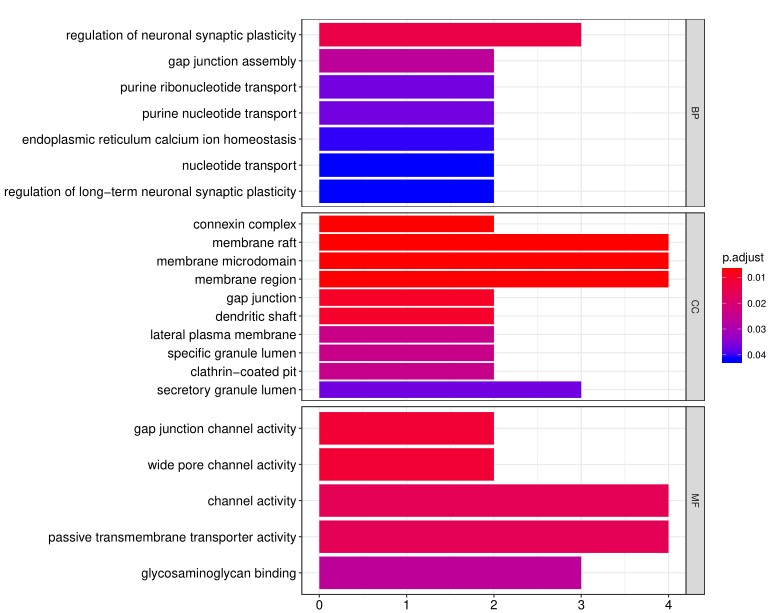
4. In addition to the standard data analysis package, customers can also choose custom data analysis services. One such service is to classify positive antigens on the array using Gene Ontology (GO) analysis, which classifies genes and proteins based on known biolgical functions. An example of the readout from GO analysis for molecular function is shown below:
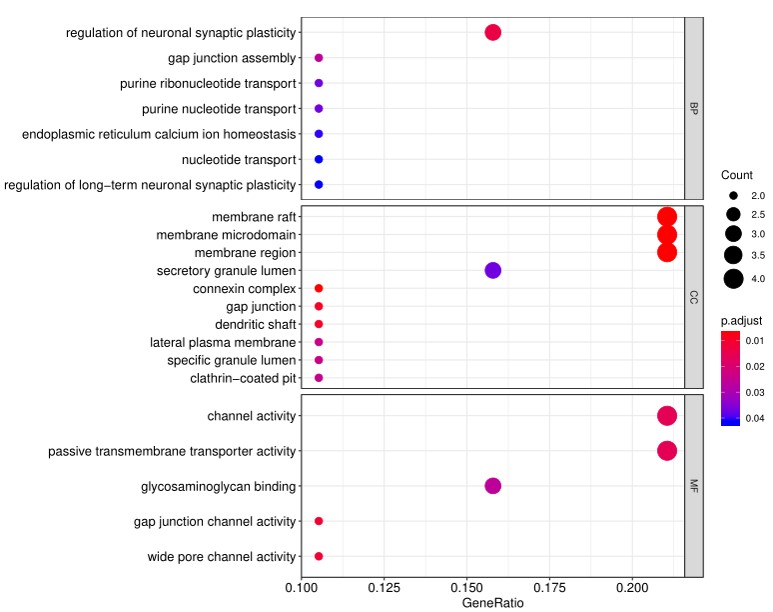
Further, GO analysis for biological processes is shown in the following example:
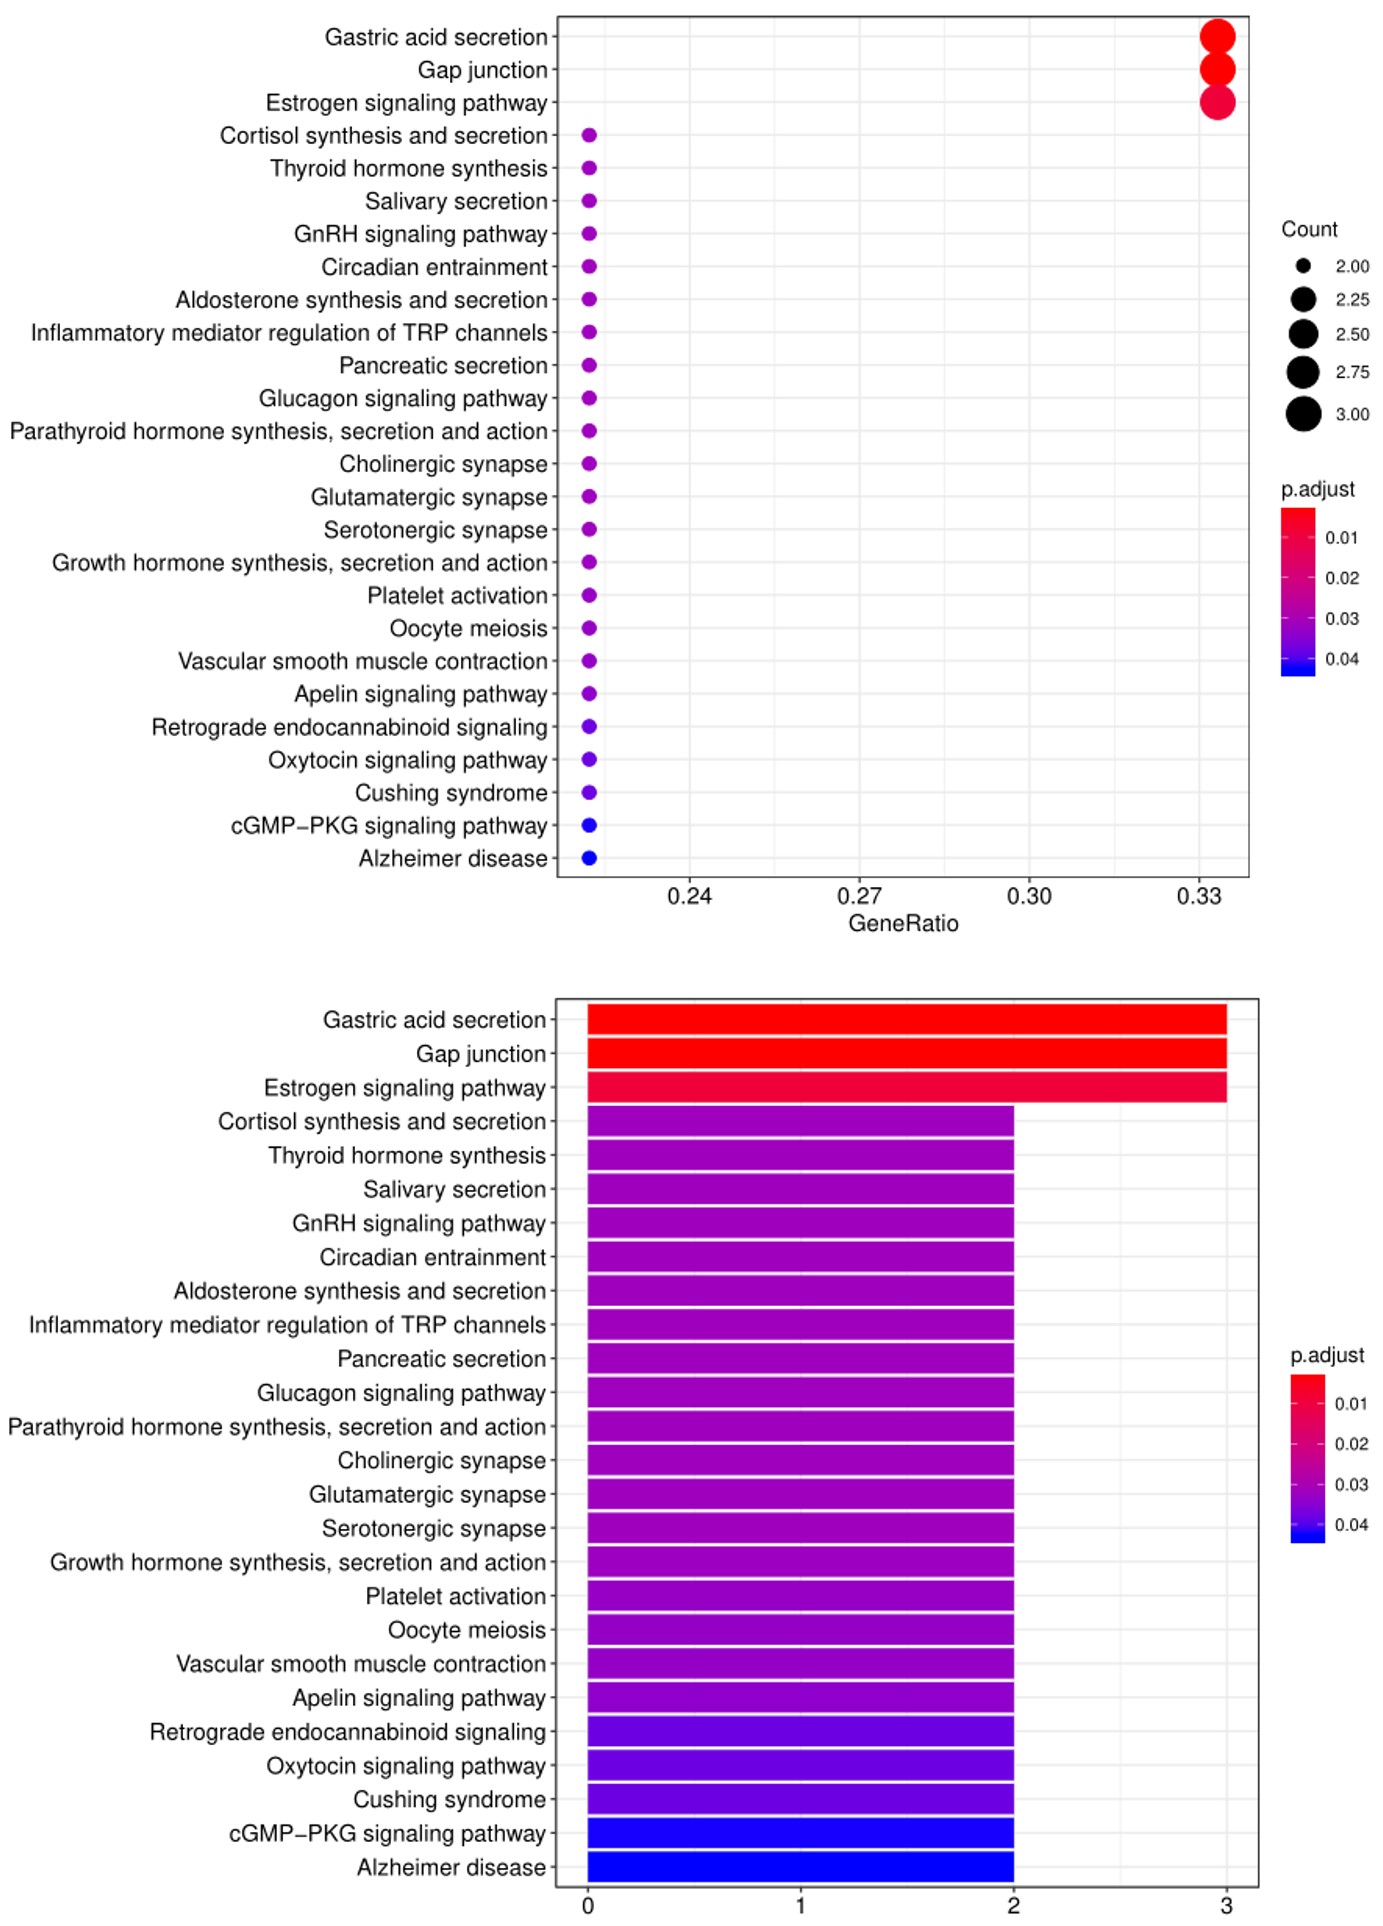
5. Another widely-used tool for bioinformatic analysis is KEGG (Kyoto Enclycopedia for Genes and Genomes) Pathway Analysis, which we use to group positive antibody-antigen interactions on the basis of defined biologica pathways, as displayed in the example below:
FAQ
Frequently Asked Questions
Answer: You can send us virtually any biological sample, including whole blood, serum, plasma, interstitial fluid, semen, urine, and saliva. To learn more, please contact us at
inquiry@genecopoeia.com.
Answer: Yes.
Answer: Yes.
Answer: Yes.
Answer: Each nitrocellulose membrane is surrounded by a gasket to prevent leakage and cross-contamination.
Answer: a. Each slide carries 16 identical arrays. One of these is reserved for a PBS control, while the remaining 15 are used for incubation of each sample. Therefore, the total number of samples sent by the customer is preferably a multiple of 15. However, if you have fewer than 15 samples, we will need to charge you for the full cost of an entire slide of 15 samples. b. Theoretically, each of the different test groups requires a minimum of 3 samples to meet statistical reproducibility requirements. On this basis, the greater the number of samples, the higher the reproducibility of the results in the test group. In order to ensure the reliability of the results, the sample size of different test groups is recommended to be ≥3.
Answer: The antigen microarray uses fluorescence detection, and its sensitivity is higher and more stable than ELISA (colorimetry) and Western (chemiluminescence). The technical repetition correlation coefficient R2 between the arrays can reach 0.9 or more. The dynamic detection range is 1-65000. The larger the dynamic range, the more layers of signals that can be detected.
Answer: Please fully communicate with our Technical Support staff before the experiment to explain the purpose of the experiment and the sample status, to determine whether we can meet your needs and determine the experimental plan.
Answer: The antigens on the antigen array are all derived from self-antigens reported in the literature. For each of the different types of antigenic arrays, we can provide you with all the names of the antigens upon reques Please do not disclose this information to third parties.
Answer: Proteins are usually expressed and purified from E. coli or mammalian cells.
Answer: We usually spot the entire full-length protein in its native conformation. However, we can also spot truncated proteins or peptides if needed.
Answer: If you need a custom antigen microarray, we need to fully communicate with you about the following issues: a. The intellectual property of the antigen (whether from a published paper or a patent, etc.). We can only provide customized detection of antigens that do not involve patent protection; b. Basic information about the antigen (whether it is whole protein or peptide, molecular weight, domain, whether it is a membrane protein, etc.); c. Whether you can provide an antigen that meets the requirements of a custom array; d. If we need to provide the antigen to be tested, the corresponding cost and experimental time frame need to be accounted for separately.
Answer: The antigens on our predesigned arrays are usually human. However, for custom arrays, we can use antigens from virtually any organism.In addition, the arrays have been used with human, mouse, and rat samples.
Answer: Antigens are usually spotted at a concentration between 0.1 and 1.0 mg/ml, but each individual protein concentration requires optimization.
Answer: a. This difference may be related to the detection method. The protein used on the array is a non-denatured protein, which is different from western blot. The hybrid system of the chip is an antigen-trapping antibody, and the western blot antigen is slightly different from the antibody after interacting with the antigen; b. Please provide a graph of the results of western blot verification, so that we can better analyze the image and data of your verified indicators on the array.